WHERE ARE YOU TODAY?
Chart Your Pathway in the Terrain of Change
👉 Take the Changemaker Questionnaire.
Answer 16 questions so we can measure and improve your
✨INFLUENCE | TEAM ENGAGEMENT & INNOVATION | TRACKING & LEARNING AGILITY✨
Takes 3 minutes - Completely Free - Immediate Recommendations
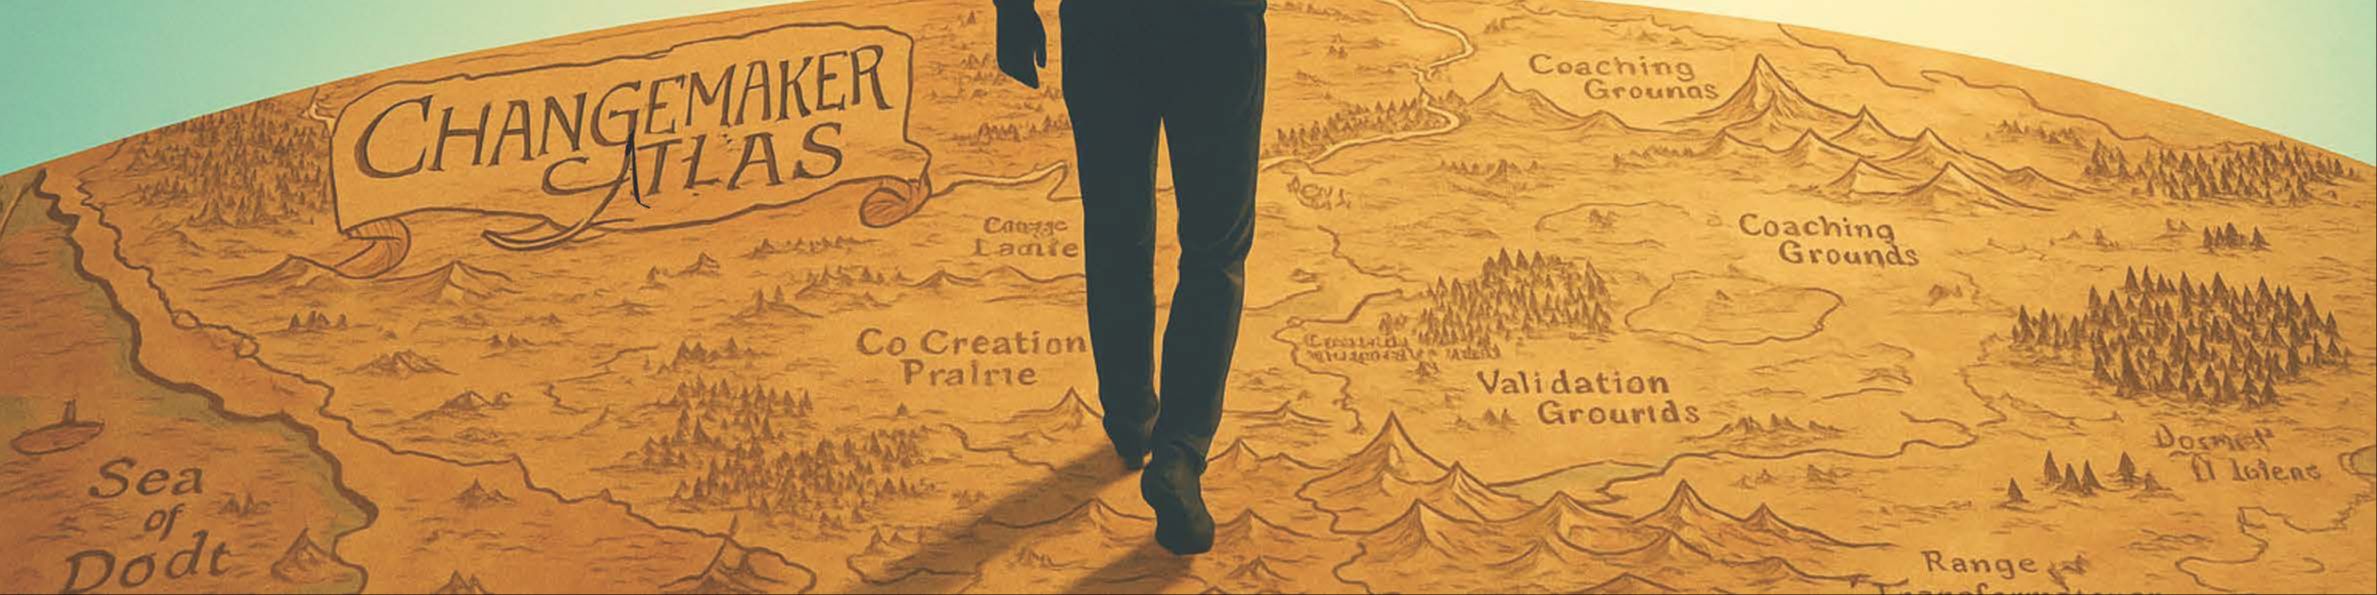
The Changemaker Atlas: A Visual and Reflective Map of Organizational Life.
It helps managers locate where they stand, and transforms complex workplace dynamics into a symbolic landscape:
mountains of work, rivers of influence, validation grounds, sea of doubt, and harbors of trust...
More than a tool, it’s a mirror: a way to see yourself, your organization, and your path to impact with renewed clarity and courage.
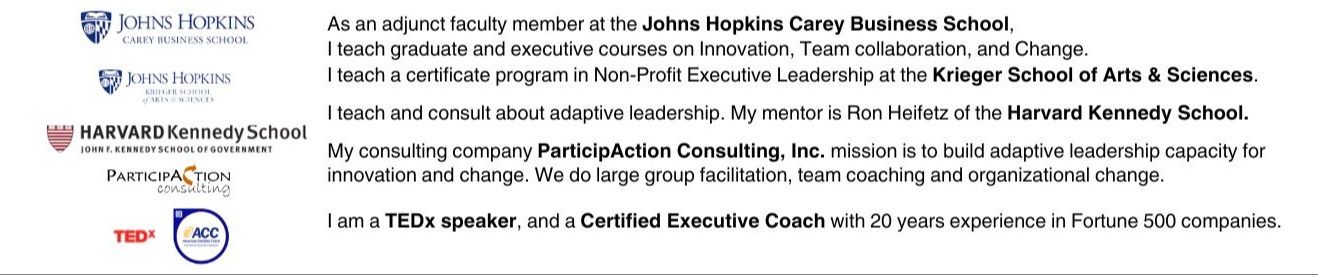
Hi! I am Adriano Pianesi.
With 20+ years as a change consultant, Johns Hopkins faculty, and executive coach, I help leaders create change in organizations.
Locate yourself in the hard terrain of change using the Changemaker Questionnaire...
✨ Chart Your Path on Land of Change!
🌊 Cross the River of Doubt
Spot what’s slowing you down—and discover the strengths that will carry you forward.
🥾 Walk the Trail of Early Wins
Celebrate quick victories that build momentum and restore your confidence.
🌉 Bridge the Canyon of Misunderstanding
Learn how to rebuild trust, alignment, and clarity with those around you.
🔥 Gather at the Campfire of Commitment
Unite your team around shared purpose and renewed energy.
🏜 Escape the Desert of Old Mindsets
Break free from patterns that drain ideas—and open space for fresh possibilities.
…and more discoveries await. 🗺
BACKED BY RESEARCH...
1. Visualization accelerates understanding
➡️ Research shows the human brain interprets images far more rapidly than text, allowing teams to grasp complex ideas at a glance. In change efforts, this means less confusion and quicker shared comprehension.
2. Maps create shared meaning
➡️ When change concepts are depicted through maps, diagrams, or metaphors, teams can literally “see” what others mean - making abstract goals concrete and consensus easier to reach.
3. Visual tools reduce overload and foster focus
➡️ Instead of drowning in reports or presentations, stakeholders can view the system as a whole - seeing how priorities connect and where to act. This clarity enhances decision-making and confidence.
4. Co-creating visuals build ownership
➡️ Research in design thinking and transformation design shows that co-creating visuals turns employees into co-authors of change, increasing engagement, trust, and sustained commitment.
